
Just a short post to share an example of producing clock faces with Arabic numbers using LuaTeX’s nodes and glue. No drawing packages were used, all done with pdf_literal nodes and some basic trigonometry to calculate positions of the numbers, angles for clock hands and values of glue to move things around. I will try to write-up the code/techniques in a future post.
Category Archives: Examples
Neat trick with LuaTeX: Passing Lua tables from TeX to Lua
It has been a long time since I wrote a blog post so I thought I’d share a rather nice “trick” I discovered today. You can pass a Lua table from a TeX macro to Lua. Here’s how.
% We start by creating a simple macro that takes one argument, but when we expand
% the macro we enclose its argument in braces {...}, which is then coerced, by Lua,
% into a table constructor!

\def\tabtest#1{
\directlua{
% This simple function is just for demo purposes
function join(a,b)
print("I was called with ("..a..","..b..")")
end

%Here's the neat bit, our TeX macro argument, enclosed in braces {...}, becomes a Lua table!
str=#1 % Yay, str becomes a Lua table!
% Here we call the join function with values in the table
str[1][1](str[1].x,str[1].y)
}}

% Here's our macro call --- \tabtest{{<--this becomes a table-->}}
% We include a pointer to the function "join", together with the values to call it with
\tabtest{%
{% start of Lua table to send
{[1]=join, x=1, y=2}
}% end table to send
}% end \tabdef call
The result of running the above calls join(1,2) and is printed to the terminal: I was called with (1,2). Rather nice, I thought!
More progress with HarfBuzz/LuaTeX (update)
Just a short post to share another example from my on-going work on HarfBuzz/LuaTeX. A rather pointless example – without using any code to correctly place mark glyphs (e.g., vowels) – showing randomly coloured Arabic glyphs. Thanks to the power of HarfBuzz and the superb Lua C API (especially C closures and “for loop” iterators) the code to process the Arabic text is about 25 lines of Lua script.
Source of text for typesetting example: BBC Arabic. I don’t know what the text says but Google Translate indicated it was neither controversial or offensive – I hope that is the case!
Update
Just to add an example with mark glyph positioning and random colours. Vowel positioning added about 10 lines of Lua script :-).
Early results of integrating HarfBuzz into LuaTeX
Building on the work of porting LuaTeX to build on Windows I decided to explore adding HarfBuzz to provide Arabic shaping. The excellent HarfBuzz API lends itself to some interesting solutions so here’s a quick post to show some early results.
Source of text for typesetting fully vowelled Arabic examples: http://en.wikipedia.org/wiki/Arabic_language#Studying_Arabic
Exploring LuaTeX nodes and boxes with Graphviz on Windows
If you are interested to explore the inner structures of TeX boxes created in LuaTeX you can do this very conveniently using the following free resources:
- viznodelist.lua by Patrick Gundlach. This is an excellent Lua script that generates a text file containing a graph representation of the structures and nodes inside a
\vbox{...}or\hbox{...}. The file output byviznodelist.luacan be opened and displayed using GVEdit (see below). - GVEdit is part of the Graphviz distribution and you can download a Windows installer from the Graphviz website
Installing Graphviz should be straightforward using the MSI installer provided. To use viznodelist.lua you’ll need to put the file in the appropriate place within your texmf tree. To find the right location you may need to look into your texmf.cnf file to examine the LUAINPUTS variable – which typically looks something like this:
LUAINPUTS = .;$TEXMF/scripts/{$progname,$engine,}/{lua,}//;$TEXMF/tex/{luatex,plain,generic,}//
For example, suppose your texmf folder is located at h:\texmf then you could put viznodelist.lua in the folder h:\texmf\scripts\lua.
Here’s an ultra-minimal plain LuaTeX example:
\directlua{require("viznodelist")}
\setbox1001= \vbox{\hsize=50 mm Hello \hbox{Hello}}
\directlua{viznodelist.nodelist_visualize(1001,"h:/texmf/mybox.gv")}
\bye
The above code will parse the contents of box 1001 and output a file called mybox.gv which you can open in GVEdit to view a graph of the the node structures in box 1001. The following screenshot displays this:
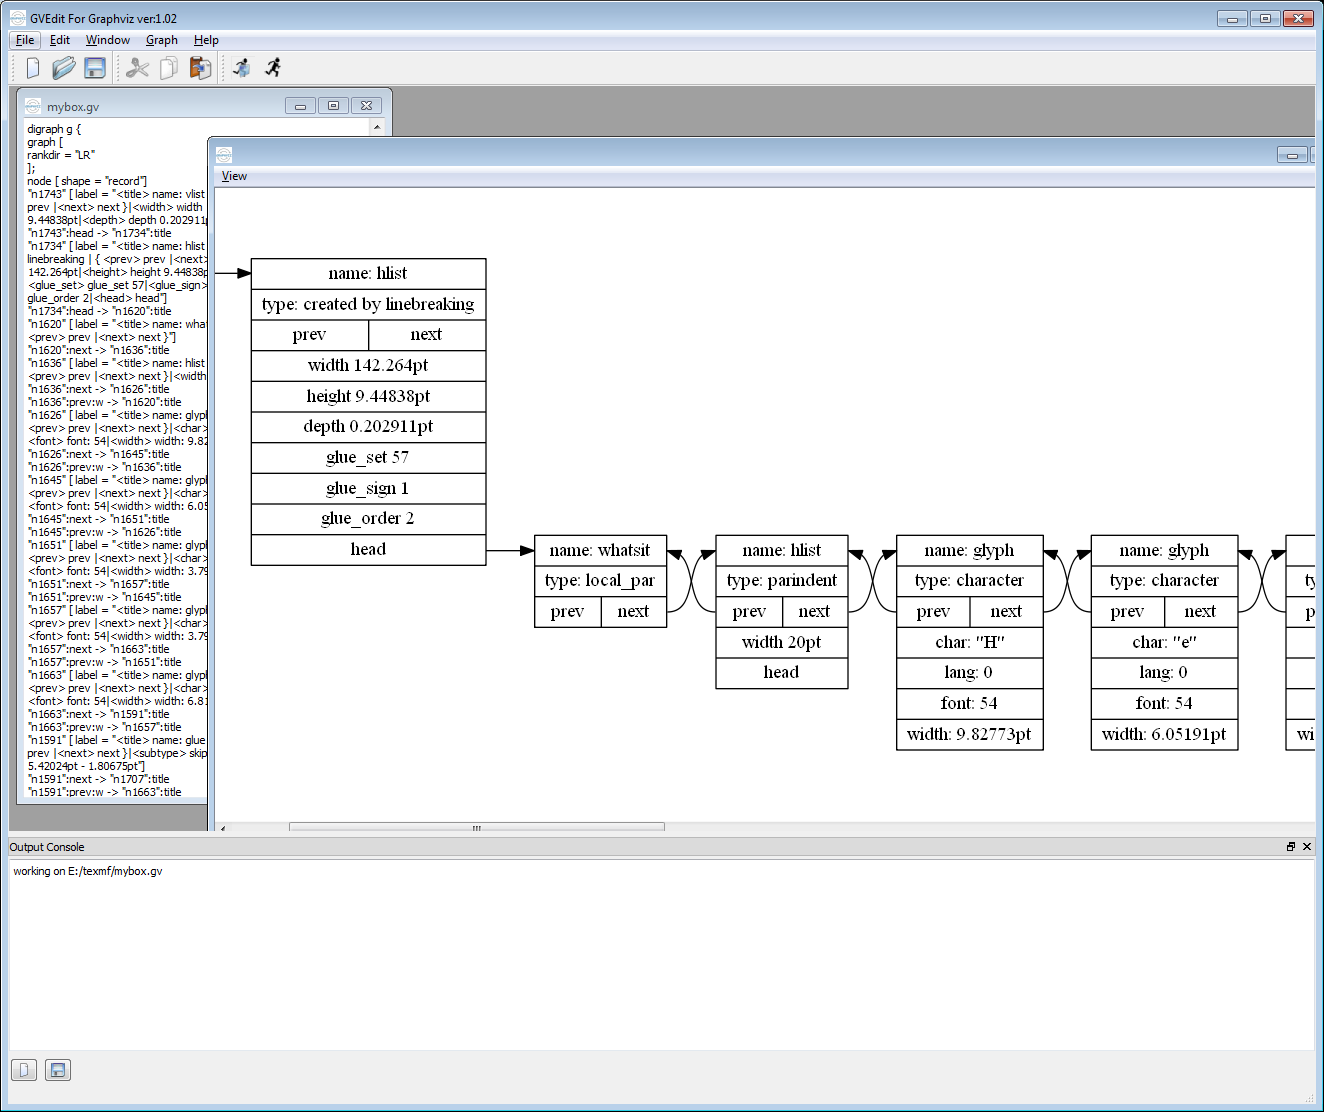
GVEdit can export the graph in numerous formats including PDF, PNG etc.
Using LuaTeX to create SVG of typeset formulae
Introduction
This is a current work-in-progress so I’ll keep it brief and outline the ideas.
There are, of course, a number of tools available to generate SVG from TeX or, more correctly, SVG from DVI. Indeed, I wrote one such tool myself some 9 years ago: as an event-driven COM object which fired events to a Perl backend. For sure, DVI to SVG works but with LuaTeX you can do it differently and, in my opinion, in a much more natural and integrated way. The key is the node structures which result from typeset maths. By parsing the node tree you can create the data to construct the layout and generate SVG (or whatever you like).
Math node structures
Let’s take some plain TeX math and store it in a box:
\setbox101=\hbox{$\displaystyle\eqalign{\left| {1 \over \zeta - z - h} -
{1 \over \zeta - z} \right| & = \left|{(\zeta - z) - (\zeta - z - h) \over (\zeta - z - h)(\zeta - z)}
\right| \cr & =\left| {h \over (\zeta - z - h)(\zeta - z)} \right| \cr
& \leq {2 |h| \over |\zeta - z|^2}.\cr}$}
What does the internal node structure, resulting from this math, actually look like? Well, it looks pretty complicated but in reality it’s quite easy to parse with recursive functions, visiting each node in turn and exporting the data contained in each node. Note that you must take care to preserve context by “opening” and “closing” the node data for each hlist or vlist as you return from each level of recursion.
The idea is that you pass box101 to Lua function which starts at the root node of the box and works its way through and down the node tree. One such function might look like this:
<<snip lots of code>>

function listnodes(head)
while head do
		local id = head.id
				if id==0 then
					mnodes.nodedispatch[id](head, hdepth+1)
				elseif id==1 then
					mnodes.nodedispatch[id](head, vdepth+1)
					else
					mnodes.nodedispatch[id](head)
				end
			if id == node.id('hlist') or id == node.id('vlist') then
				--print("enter recursing", depth)
					if id==0 then
						hdepth=hdepth+1
					elseif id==1 then
						vdepth=vdepth+1
						else
					end
				--mnodes.open(id, depth,head)
    			listnodes(head.list)
					if id==0 then
						mnodes.close(id, hdepth)
						hdepth=hdepth-1
					elseif id==1 then
						mnodes.close(id, vdepth)
						vdepth=vdepth-1
						else
					end
				--print("return recursing", depth)
		end
	head = head.next
end
end
What you do with the data in each node depends on your objectives. My preference (current thinking) is to generate a “Lua program” which is a set of Lua functions that you can run to do the conversion. The function definitions are dictated by the conversion you want to perform. For example, the result of parsing the node tree could be something like this (lots of lines omitted):
HLISTopen(1,13295174,0,2445314,2772995,0,0,0)
MATH(0,0)
HLISTopen(2,0,0,0,0,0,0,0)
HLISTclose(2)
GLUE(skip,109224,0,0,0,0)
VLISTopen(1,13076726,0,2445314,2772995,0,0,0)
HLISTopen(2,13076726,0,622600,950280,0,0,0)
GLUE(tabskip,0,0,0,0,0)
HLISTopen(3,5670377,0,622600,950280,0,0,0)
RULE(0,557056,229376)
GLUE(skip,0,65536,0,2,0)
MATH(0,0)
HLISTopen(4,5670377,0,622600,950280,0,0,0)
HLISTopen(5,5670377,0,622600,950280,0,0,0)
VLISTopen(2,218453,-950280,1572880,0,0,0,0)
HLISTopen(6,218453,0,393220,0,0,0,0)
GLYPH(12,19,218453,0,393220)
HLISTclose(6)
KERN(0,0)
HLISTopen(6,218453,0,393220,0,0,0,0)
GLYPH(12,19,218453,0,393220)
HLISTclose(6)
KERN(0,0)
HLISTopen(6,218453,0,393220,0,0,0,0)
GLYPH(12,19,218453,0,393220)
HLISTclose(6)
KERN(0,0)
HLISTopen(6,218453,0,393220,0,0,0,0)
GLYPH(12,19,218453,0,393220)
HLISTclose(6)
VLISTclose(2)
HLISTopen(6,2805531,0,576976,865699,0,0,0)
HLISTopen(7,2805531,0,576976,865699,0,0,0)
HLISTopen(8,78643,-163840,0,0,0,0,0)
HLISTclose(8)
VLISTopen(2,2648245,0,576976,865699,0,0,0)
HLISTopen(8,2648245,0,0,422343,2,1,17)
GLUE(skip,0,65536,65536,2,2)
GLYPH(49,1,327681,422343,0)
GLUE(skip,0,65536,65536,2,2)
HLISTclose(8)
KERN(266409,0)
RULE(-1073741824,26214,0)
KERN(145167,0)
HLISTopen(8,2648245,0,127431,455111,0,0,0)
GLYPH(16,7,286721,455111,127431)
KERN(48355,0)
GLUE(medmuskip,145632,72816,145632,0,0)
GLYPH(0,13,509726,382293,54613)
GLUE(medmuskip,145632,72816,145632,0,0)
GLYPH(122,7,304775,282168,0)
KERN(28823,0)
GLUE(medmuskip,145632,72816,145632,0,0)
GLYPH(0,13,509726,382293,54613)
GLUE(medmuskip,145632,72816,145632,0,0)
GLYPH(104,7,377591,455111,0)
HLISTclose(8)
VLISTclose(2)
HLISTopen(8,78643,-163840,0,0,0,0,0)
HLISTclose(8)
HLISTclose(7)
HLISTclose(6)
GLUE(medmuskip,145632,72816,145632,0,0)
GLYPH(0,13,509726,382293,54613)
GLUE(medmuskip,145632,72816,145632,0,0)
HLISTopen(6,1626950,0,576976,865699,0,0,0)
HLISTopen(7,1626950,0,576976,865699,0,0,0)


<<snip loads of lines>>


GLYPH(58,7,182045,69176,0)
HLISTclose(4)
MATH(1,0)
GLUE(skip,0,65536,0,2,0)
HLISTclose(3)
GLUE(tabskip,0,0,0,0,0)
HLISTclose(2)
VLISTclose(1)
GLUE(skip,109224,0,0,0,0)
MATH(1,0)
HLISTclose(1)
At each node you can emit a “function” such as GLUE(skip,0,65536,65536,2,2) or GLYPH(49,1,327681,422343,0) which contain the node data as arguments of the function call. Each of these “functions” can then be “run” by providing a suitable function body: perhaps one for SVG, HTML5 canvas and JavaScript, or EPS file or whatever. The point is you can create whatever you like simply by emitting the appropriate data from each node.
What about glyph outlines?
Fortunately, there is a truly wonderful C library called FreeType which has everything you need to generate the spline data, even with TeX’s wonderfully arcane font encodings for the 8-bit world of Type 1 fonts. Of course, to plug FreeType into the overall solution you will need to write a linkable library: I use DLLs on Windows. FreeType is a really nice library, easy to use and made even more enjoyable by Lua’s C API.
Summary
Even though I have omitted a vast amount of detail, and the work is not yet finished, I hope you can see that LuaTeX offers great potential for new and powerful solutions.