Word 2007 and beyond can upload content directly to blogs. So, I was curious to see how well Word can post tables to my blog. Results below, untouched and exactly as they appeared after upload.
The actual data uploaded by Word is amazingly clean/simple! I thought it would be horribly complicated but I was delighted to be wrong! Clearly, the presentation you see is affected by this site’s WordPress theme CSS. Which I admit does not look that good. In the WordPress content editor, the tables look great and are easy to edit. See screenshot below.
As a way to write offline and then post to your blog, it could have its uses.
Screenshot of the behind-the-blog content editor.
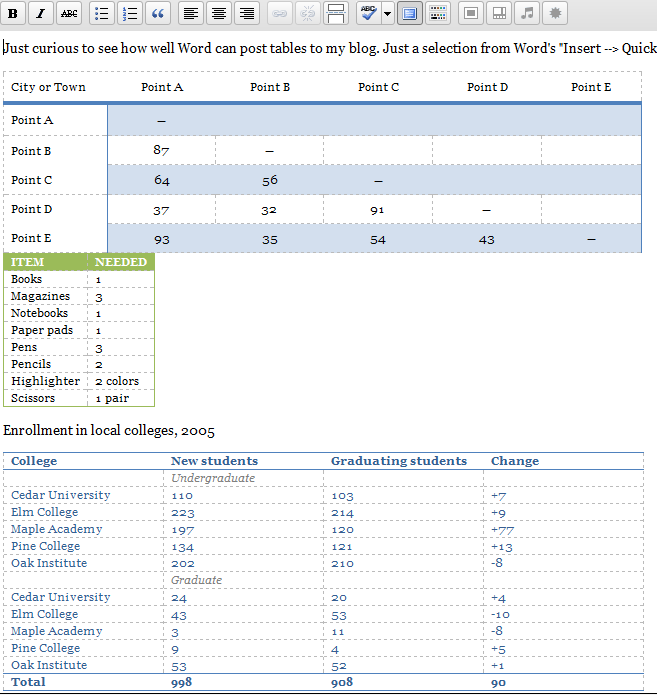
Raw and untouched tables: a selection from Word’s “Quick Tables” facility. Compare with the content editor view above.
| City or Town |
Point A
|
Point B
|
Point C
|
Point D
|
Point E
|
| Point A |
—
|
|
|
|
|
| Point B |
87
|
—
|
|
|
|
| Point C |
64
|
56
|
—
|
|
|
| Point D |
37
|
32
|
91
|
—
|
|
| Point E |
93
|
35
|
54
|
43
|
—
|
| ITEM |
NEEDED |
| Books |
1 |
| Magazines |
3 |
| Notebooks |
1 |
| Paper pads |
1 |
| Pens |
3 |
| Pencils |
2 |
| Highlighter |
2 colors |
| Scissors |
1 pair |
Enrollment in local colleges, 2005
| College |
New students |
Graduating students |
Change |
|
Undergraduate |
|
|
| Cedar University |
110 |
103 |
+7 |
| Elm College |
223 |
214 |
+9 |
| Maple Academy |
197 |
120 |
+77 |
| Pine College |
134 |
121 |
+13 |
| Oak Institute |
202 |
210 |
-8 |
|
Graduate |
|
|
| Cedar University |
24 |
20 |
+4 |
| Elm College |
43 |
53 |
-10 |
| Maple Academy |
3 |
11 |
-8 |
| Pine College |
9 |
4 |
+5 |
| Oak Institute |
53 |
52 |
+1 |
| Total |
998 |
908 |
90 |
Source: Fictitious data, for illustration purposes only